Cirkel
MVP design of B2B/B2C web platform that enables virtual peer learning circles
UX/UI Designer | Team of 3 | Aug. 2023 - Sept. 2023
Cirkel
-
Client
Cirkel is an early-stage SaaS startup building a B2B/B2C platform that fosters trust and psychological safety through supportive peer group sessions.
-
Problem
The client identified a deficiency in psychologically safe peer learning groups within the digital space that was intuitive for facilitators to easily manage and improve their sessions using concrete data and metrics.
-
Solution
Our end-to-end MVP dashboard design streamlined content management, enhanced group interaction, and provided data insights for informed decision-making.
Final Designs
Cirkel Facilitator Onboarding:
Set up a new Cirkel session efficiently and effortlessly through a survey and simple interactions.
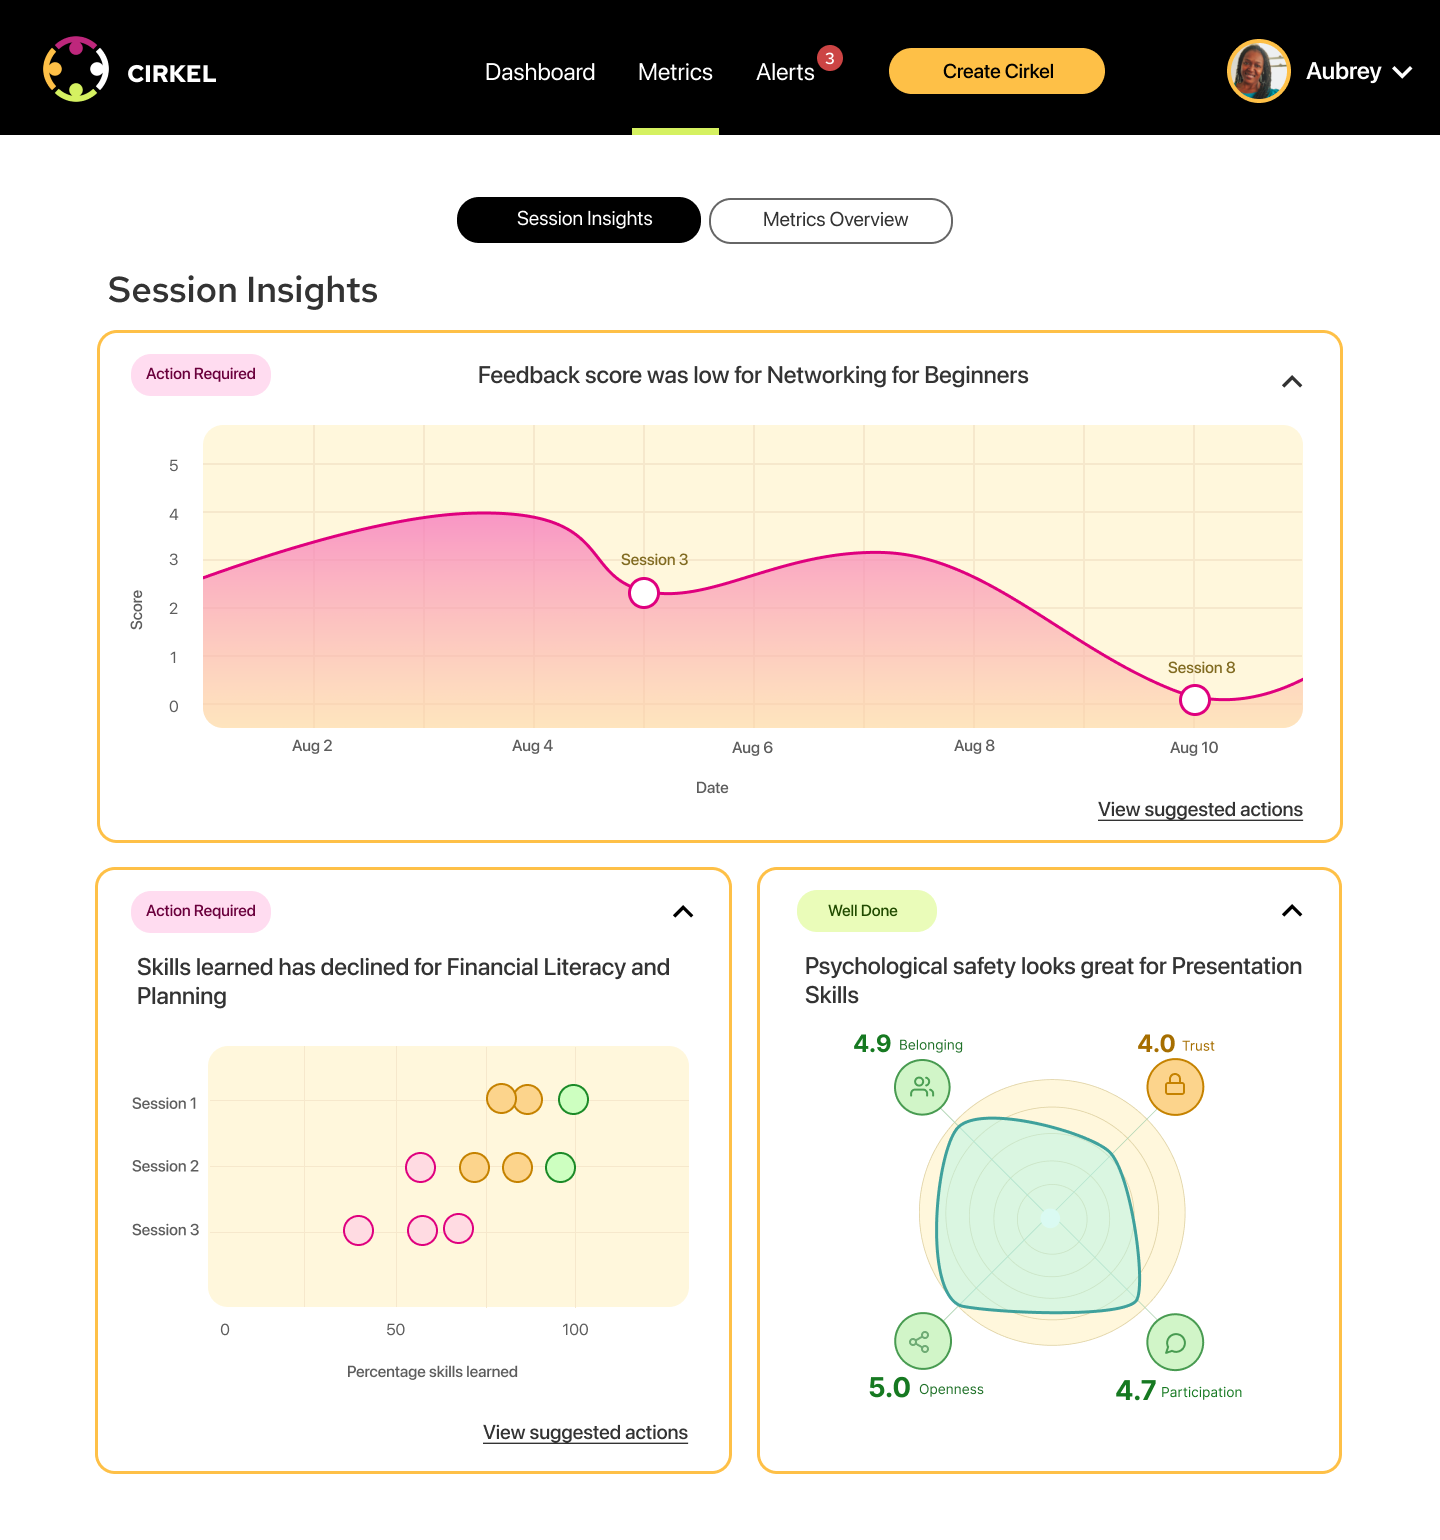
Cirkel Facilitator Metrics:
View aggregated data, metrics, and session insights.
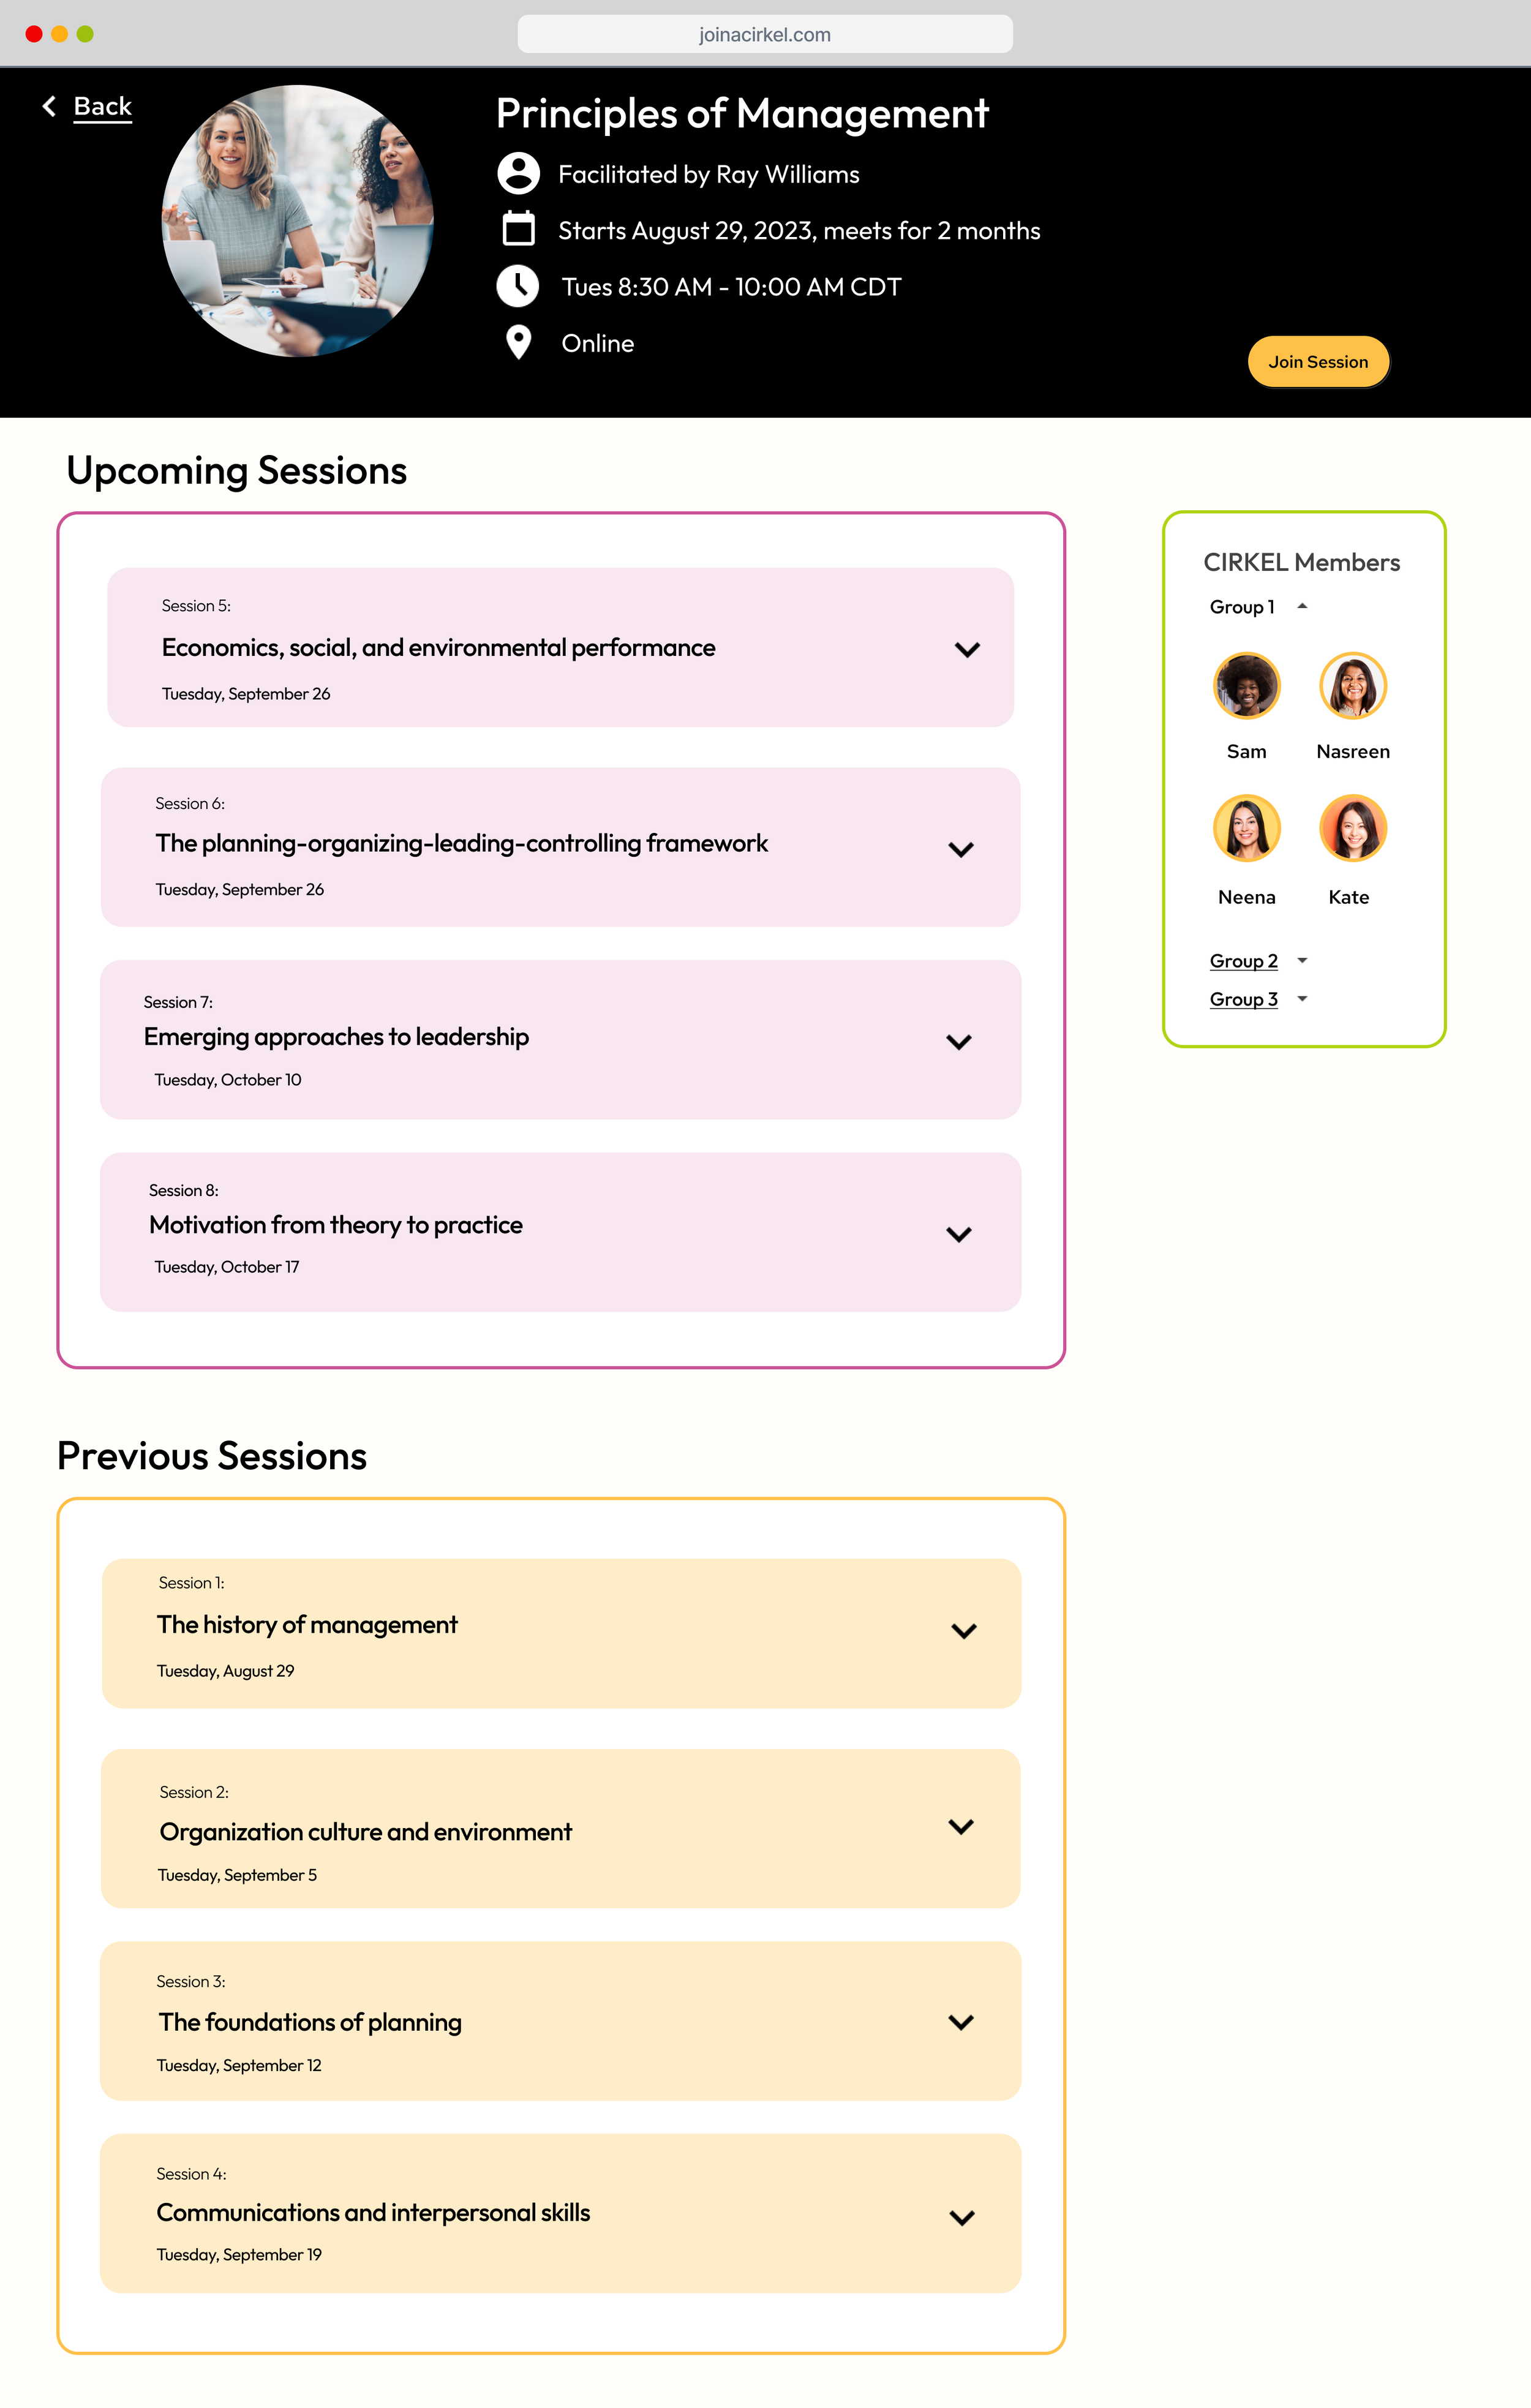
Cirkel Facilitator Dashboard:
Join a live session, view alerts, and see your session content.
Design Process
My design process is iterative and non-linear, allowing me to revisit and refine each step as needed to create the best user experience.
Competitor Analysis (Secondary research)
Interviews
Discover
Affinity Map
Personas
How might we…
Define
Ideate
User Flows
Prototype
Mid-Fidelity Wireframes
High-Fidelity Wireframes
Usability Testing
Iterations
Validate
PROJECT PLAN
In a collaborative effort, our trio of UX designers seamlessly tackled a demanding timeline, strategically established clear objectives, and harmonized our design approach to ensure perfect alignment on deliverables and deadlines in our project plan.
Discover | COMPETITIVE ANALYSIS
During the research phase, we conducted a comprehensive competitive analysis. This involved an in-depth examination of key competitors in the learning circle space. We analyzed their user interfaces, navigation, and overall user experiences to gain valuable insights into industry best practices and identify areas for differentiation. This competitive analysis was pivotal for multiple reasons:
Firstly, it granted us a comprehensive understanding of the market landscape, showcased existing solutions, competitor strategies, and strengths within learning circle platforms.
Secondly, this analysis allowed us to identify gaps and opportunities in competitor platforms.
Moreover, it informed our decision-making process, enabling us to make strategic, data-driven choices aligned with user needs and market demands.
This meticulous analysis enabled us to pinpoint opportunities for improvement and innovation, which we strategically integrated into our designs to meet business goals and objectives.
Through comprehensive competitor research, we identified a discernible void in the process of collecting and presenting actionable data in a format that would truly empower businesses and facilitators to enhance their organizations and instructional approaches effectively.
Discover | INTERVIEWS
Participants agree: Collecting aggregated data is crucial for ensuring the success of a peer circle, yet it poses significant challenges.
My team and I conducted five comprehensive interviews with facilitators across diverse platforms, encompassing coaching, peer circles, education, and medical training contexts. We sought insights into the data collection methods employed by the platforms they utilized and the key metrics that held significance in their roles as facilitators.
Key Research Questions
Which key performance metrics do our users consider vital to drive value for their businesses?
What metrics do facilitators (users) rely on to assess the success of their interactions within the platform?
What actionable metrics do facilitators use to ensure a positive end-user experience (satisfaction, engagement, etc.)?
In what ways can we empower facilitators to measure the effectiveness of their sessions?
How does a company demonstrate its impact and value to users?
Excerpts From Interviews
“The data we collect is pretty soft, because it is self reported data. There's much to be desired from these companies to understand how to really quantify the impact that coaching is having on their business.”
— Participant 1
“I was able to observe positive feedback through surveys as measurable results after running the peer sessions.”
— Participant 2
“You need many sources to gage success of peer groups. RASCI - Responsible, Accountable, Supportive, Consultative, Informed, CRM that looks at ALL metrics, surveys, and goals met.
— Participant 3
“…always looking for ways to improve content…no tool to really assess it from a high level.”
— Participant 4
Define | AFFINITY MAPPING
Our team of designers used FigJam to synthesize our interview data and started to put together clusters of themes that we were noticing.
I diagrammed the connections among interview themes, ultimately identifying five critical insights that would shape our product design strategy.
Key Insights
Metrics are Vital
The inclusion of metrics serves as vital tools for gauging session success and substantiating the alignment of these sessions with overarching business objectives.
Establish Trust and Belonging
Fostering trust and establishing an atmosphere of inclusion contribute to the learning process and stronger connections.
Adjusting to Learner’s Needs
Given the dynamic nature of sessions, ongoing modifications aligned with learners' needs are imperative to ensure a responsive and impactful learning journey.
Structure is Needed
Clarity in expectations, agendas, objectives, and goals is paramount. This approach instills purpose, meaning, and active engagement in the session.
Managing Pacing with Intention
Although managing pacing can be difficult, it remains a necessary aspect guided by the facilitator.
Define | PERSONAS
Based on the synthesized research insights, we developed two user personas to effectively communicate the pain points, motivations, and goals of a facilitator of a Cirkel session.
How might we...design a dashboard that incorporates meaningful and useful metrics to drive learning and meet business goals?
Ideate | USER FLOWS
Considering our constrained timeline and the objective to design a facilitator dashboard, we opted to emphasize user persona flows related to onboarding, conducting sessions, and accessing aggregated metrics from the facilitator's viewpoint.
Flow 1: Create a Session
As a facilitator, I want to create a Cirkel session and go through the onboarding process.
Flow 2: Join a Session
As a facilitator, I want to join a Cirkel session.
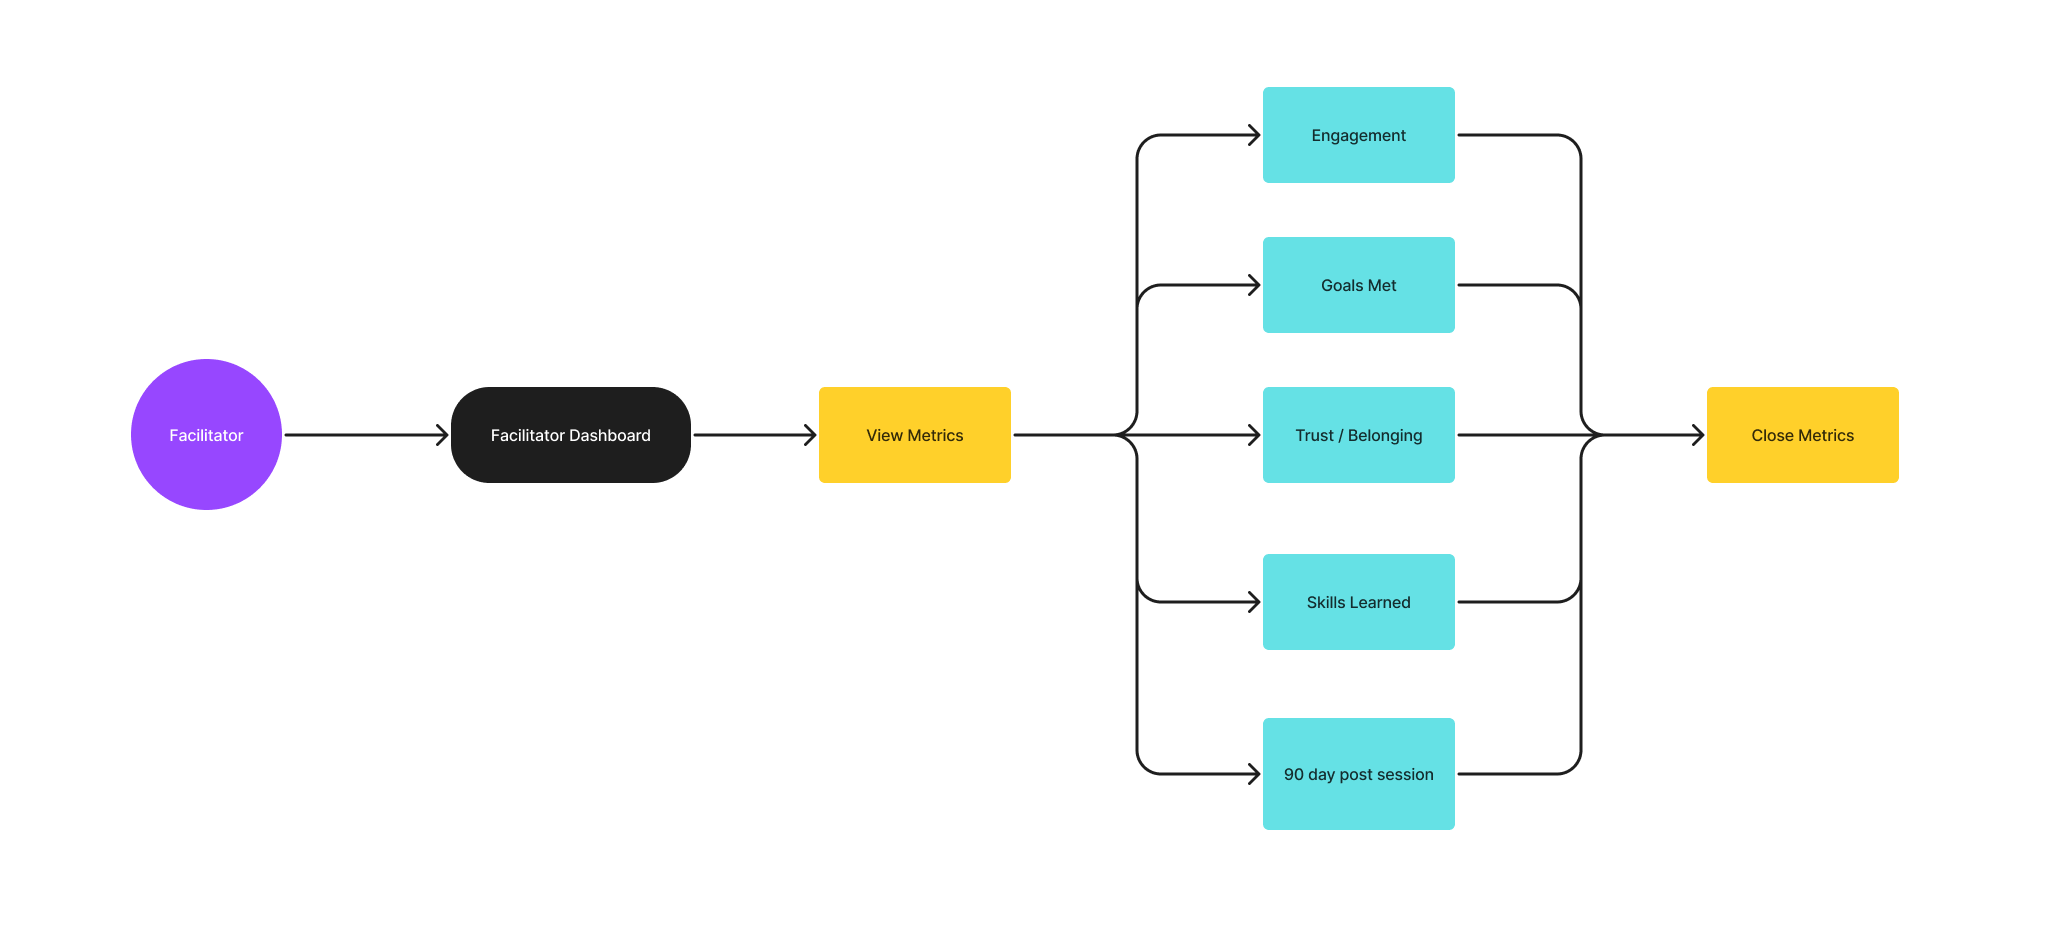
Flow 3: View Metrics
As a facilitator, I want to view my session metrics and see aggregated data so I can leverage data insights.
Prototype | MID-FIDELITY WIREFRAMES
Building our blueprints for a seamless user experience
Making sure we were efficient with our time, we decided that each designer would design low-fidelity wireframes for essential screens. We decided which design elements and screens to move forward with and then each designer focused on one user flow and designed the high-fidelity wireframes.
Facilitator Dashboard Screen
Facilitator In Session Screen
Aggregated Data Screen
Session Metric Screen
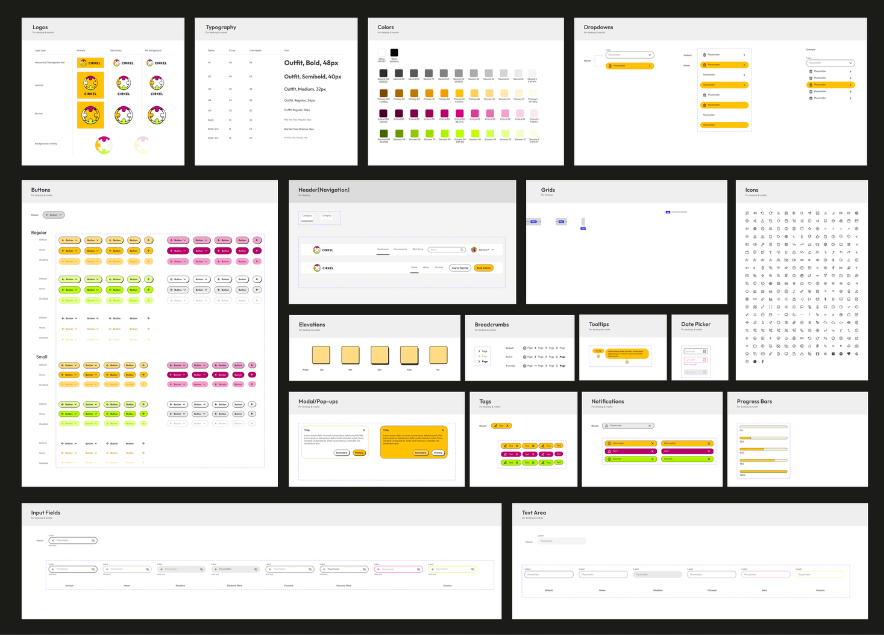
The visual design elements represent Cirkel’s joyful and supportive brand
As a team we created branding elements and a design system and ensured accessibility before client handoff.
Brand values: connection, joy, vitality, trust, love
Brand attributes: mass appeal, playful, friendly, conventional, young/innovative
Validate | USABILITY TESTING
Dashboard Issues:
Round 1: Before creating our high-fidelity prototype we conducted five moderated usability tests to test for usability issues and areas for potential improvements.
Navigation bar move to the top of page so it is prominent on page and takes up less space.
Action items could be more subtle to not overload the user.
Dashboard Improvements:
Action items are now sublty displayed as an alert
Navigation bar moved to the top of page.
Validate | USABILITY TESTING
Metric Screen Issues:
Asked participants for feedback on the two metric screens we designed.
Use clear metric graphics that are recognized and understood by all users.
Metric Screens Improvements:
All 5 participants and the client agreed that it was important to include both screens in our designs to show metrics from a session and also be able to see the holistic aggregated data.
Iterated to make sure all metric graphics can be recognized and understood by users.
Validate | USABILITY TESTING
Session Screen Issues:
Ability to join a LIVE session
Ability to see all members in each group
Session Screen Improvements:
Added a button to join a LIVE session and kept all editing functions in the creating a session
Added the ability to see all members in each group
Validate | USABILITY TESTING
Round 2: After creating our high-fidelity screens with all of the iterations from our first usability test we conducted five more moderated usability tests to test for usability issues and areas for potential improvements.
Issues:
Onboarding
Clearly defined required information and optional information
Enhanced Personalization: Tailoring User Experiences with User-Centric Copy, Preview Options, and a Congratulations Screen.
More questions and options for a very personalized Cirkel creation.
Session Screen
Ability to seamlessly join any Cirkel session that is live
Ability to see overall participants of each Cirkel peer group
Metric Screens
Included option to add your own actions to the metric screen, depending on session needs
Improvements:
Onboarding
Define required information and optional information
Personalize the user experience more through tone, copy, and visuals.
More questions and options for a very personalized Cirkel
Session Screen
No Ability to seamlessly join any Cirkel session that is live
Show overall participants of each Cirkel peer group
Metric Screens
Option to add your own actions to the metric screen, depending on session needs
Prototype | FINAL DESIGN
See our final prototype to see the iterations that we made after our second round of usability tests.
Final Interactive Prototype
Lessons Learned
-
Project Management
I have a strong knack for taking the lead and managing projects. I keep the project moving while keeping up with all of the moving parts which include, setting up and coordinating user interviews and usability testing, keeping all files organized, and ensuring everyone is staying on the same page through meetings, emails, and calendar updates.
-
Research Findings
I've also recognized my talent for diving deep into the finer details of our designs. I'm meticulous about making sure every element is thoroughly thought out and serves a clear purpose, all grounded in our research findings. I made sure we had done thorough research even though we were on a tight time frame.
-
Team Player
I've learned that I excel as a team player too. I can mediate with finesse between our designers, ensuring a smooth integration of everyone's ideas and resolving any disagreements that may arise. It's all about maintaining a harmonious atmosphere in our fantastic team and I have being a middle child to thank for this skill!
Added Value
Our designs added substantial value to the client by providing them with a fully functional prototype of the facilitator dashboard, equipping them with a powerful tool to confidently present and pitch to potential investors.
“We are so happy you were able to take what we have envisioned and put all of that into your designs and add things to enhance them that we didn’t even think of.”
Nina, CEO Cirkel and Co-Founder
Next Steps
AI Integration Evaluation: The client's AI consultation will assess the feasibility of our integrated AI design and explore potential AI enhancements.
High-Fidelity Usability Testing: The next phase involves a third round of usability testing, building on the insights gained from our initial two rounds to further refine the user experience.
Refine High-Fidelity Designs: In response to usability test results, iterations on content and UI elements to ensure their intuitiveness and relevance, enhancing the overall user experience.


